I graduated from the University of Iceland in February 2024 with a master’s degree in applied statistics, earning first-class honors.
Since then, I have worked as a Data Analyst, focusing on building dashboards,
developing data pipelines, and delivering analyses to support operational decision-making.
I am now seeking opportunities to further grow in the field of data science and analytics, either in Reykjavík or Zürich.
As a citizen of an EFTA country, I have the right to live and work in Switzerland without restrictions.
Skills Overview
Through my education and by working on various data analysis projects, both professionally and in my free time, I have gained solid experience in the field. I can efficiently clean, organize, analyze, and visualize data, and I have worked with tools such as Power BI, Tableau, R Shiny, and Excel for data visualization. I am proficient in both Python and R programming, have experience building ETL pipelines, and have applied a variety of statistical tests and predictive models.
With my background in psychology, I am also skilled in survey design and understanding human behavior, which adds valuable context to data analysis.
Excited to level up my data skills, I'm currently diving more into ETL pipelines and learning new prediction methods.
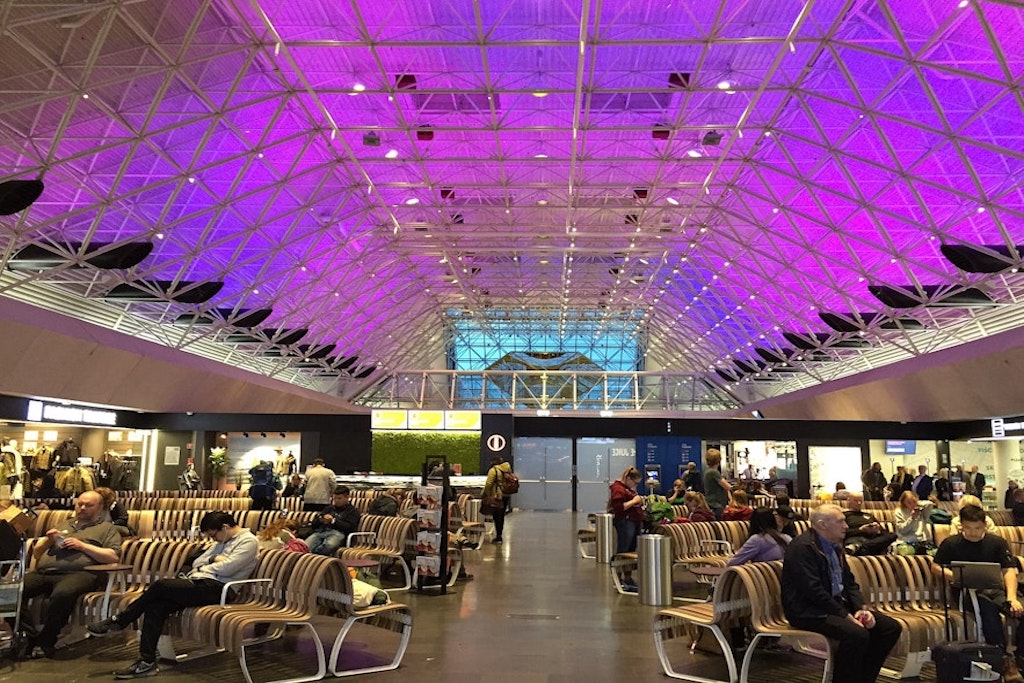
Built an automated pipeline on Google Cloud that
ingests KEF Airport flight data via API into BigQuery and
powers a daily-refreshed Looker Studio dashboard tracking punctuality,
delays, and cancellations by airline.
The Zurich Traffic Accident Analysis Dashboard provides insightful visualizations
and summary statistics related to police-registered road traffic accidents in
Zurich since 2011. Using data sourced from open data Switzerland, which
includes detailed records of accident locations, times, types, and severity
categories, this dashboard offers a comprehensive overview of accident trends.
Built with Quarto and enhanced by Shiny components, it features interactive
filtering options to explore data by year, month, day, and type of accident.
The map visualization is powered by Leaflet, and the plots are rendered using
Plotly to provide a dynamic, user-friendly analysis tool.
See Code
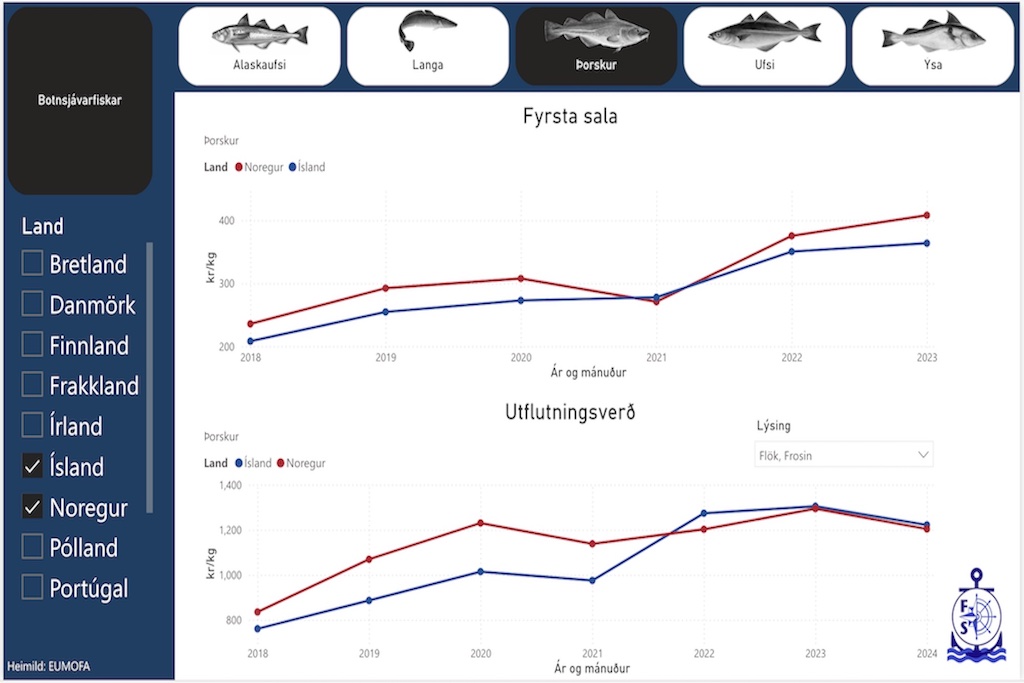
In summer 2024, I worked as a data analyst for the Union of Icelandic Captains.
Their objective was to make better use of publicly available data by creating simple,
easy-to-read Power BI dashboards.
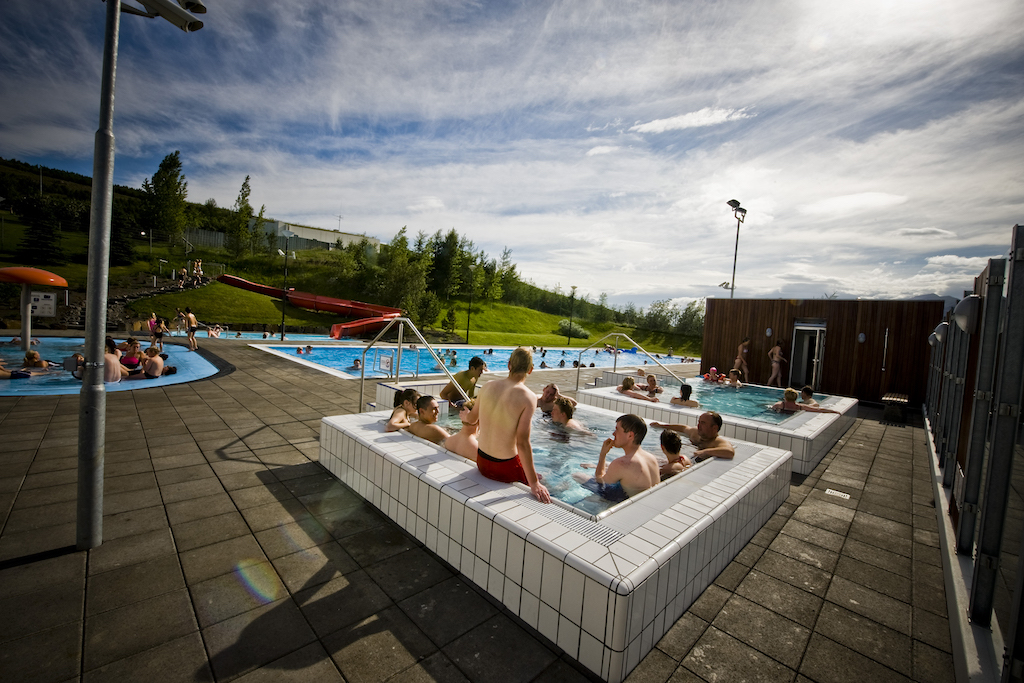
The Reykjavik Swimming Pool Attendance Dashboard provides insightful visualizations
and summary statistics related
to swimming pool attendance in Reykjavik. Using past data sourced from the official
website of Reykjavík city (https://gagnagatt.reykjavik.is/), which records the number of
people entering the pool each hour,
this dashboard offers a comprehensive overview of attendance trends.
With interactive features such as selecting specific swimming pools,
time ranges, weekdays, and dates, users can explore patterns in attendance.
This project, conducted in R, predicted housing prices in Reykjavík. The dataset underwent cleaning, and analyses included variable adjustments and outlier removal. Comparing lasso regression and Random Forest, the latter proved more accurate in forecasting Reykjavík housing prices.
In this project, I conduct a time series analysis of the number of passengers
passing through Keflavik Airport and attempt to fit a model that predicts the monthly
number of passengers for data the model has not seen. The data for the number of passengers
passing through Keflavik Airport was obtained from the
Iceland Statistics Website: https://statice.is/statistics/business-sectors/tourism/passengers/.
After relocating to Zurich, a question that frequently came up was whether it was excessively expensive.
I often explain that, while some things are pricier, others are not, like beer.
To better grasp if Zurich is more expensive than Reykjavik,
I created a very simple yet effective comparison dashboard in Power BI using data from www.numbeo.com.
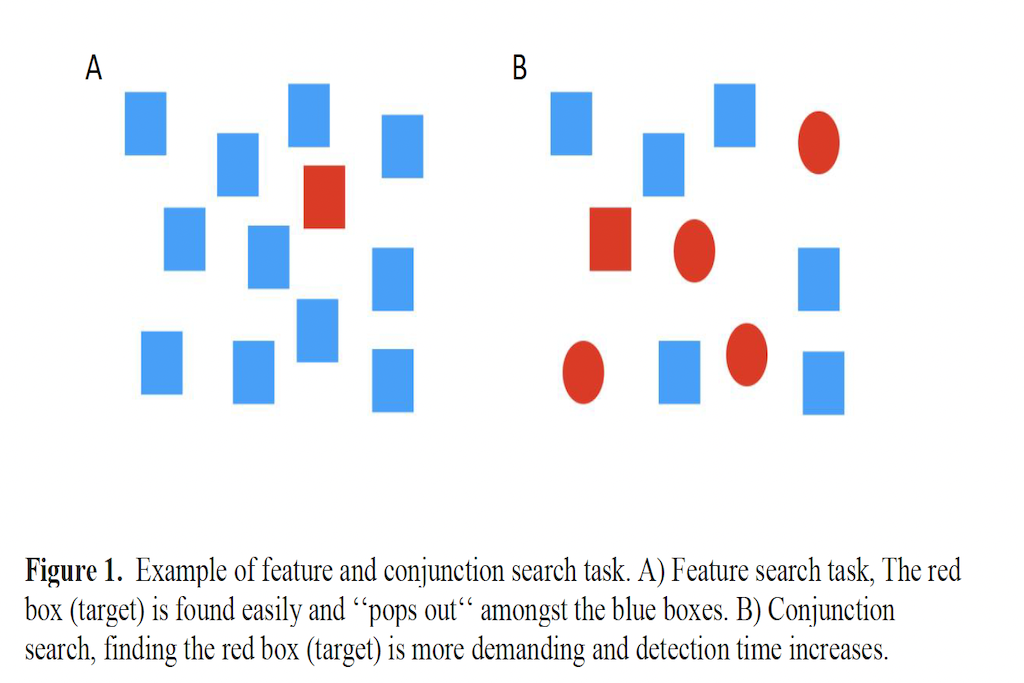
In my Bachelor's thesis, I conducted a study on the psychological phenomenon
known as priming. The aim of this research was to explore whether individuals possess
the ability to encode the probability distribution of targets during a visual search
task. Additionally, the study examined whether these encoded probabilities influence
the efficacy of priming in visual search.
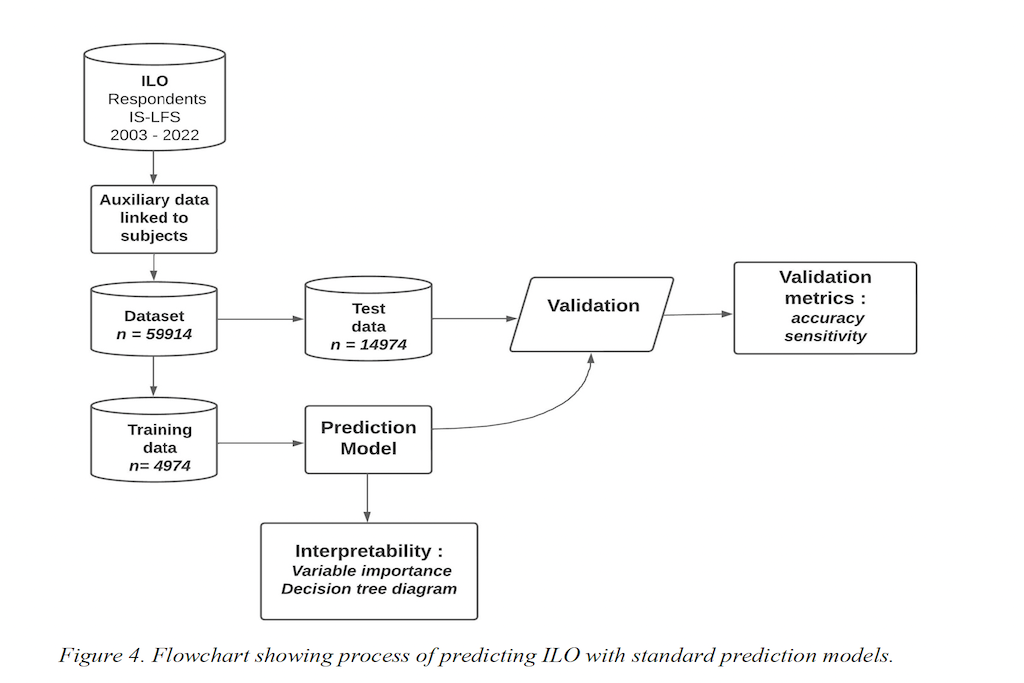
In my Master's thesis, I conducted research in collaboration with Statistics Iceland,
examining the potential of imputation using available administrative data.
The assessment was based on prediction accuracy.
To achieve this, I investigated various multiple imputation approaches as well as other standard prediction methods.